Moving Beyond ‘Checking the Box:’ Taking Data from Compliance to Curiosity


Community schools use data in a wide range of ways, from conducting needs assessments and asset mapping, to providing reports to state agencies and funders, to engaging in continuous improvement practices. But too often, we put a lot of that data back on the (physical or metaphorical) shelf after it’s served a specific purpose. It goes into a black hole of sorts, which means it’s not really part of how we come to decisions or engage interest holders.
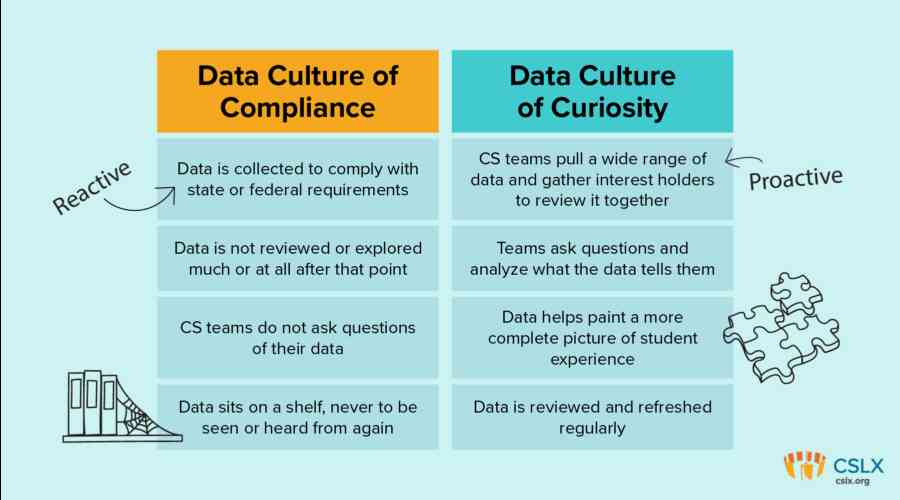
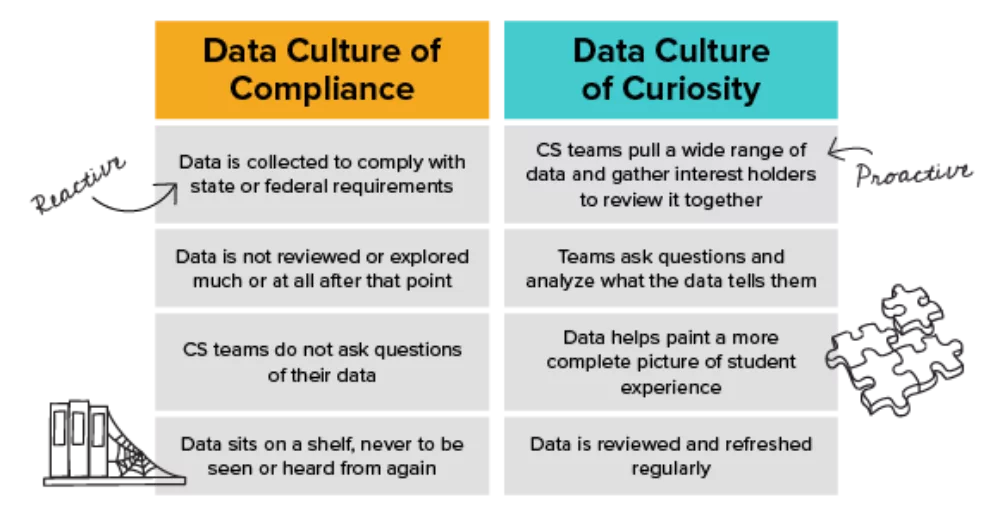
From our point of view, this is what it means to work within a data culture of compliance: we send data to the state, the district, or to funders, and often don’t get any kind of useful analysis or report back (and if we do, it’s sometimes a case of too little, too late). Different types of data are disconnected from each other, and it’s hard to create space to fully explore what our data is telling us.
But what if we were to move from a mindset of compliance to one of curiosity? To bring different pieces of data together, like a mosaic, to fill in a more complete picture of the experiences of students and adults connected to your school?
When you do the work to see how all the different pieces of data fit together– and ask questions so you can understand the root causes underlying what the data is telling you–you gain a more complete understanding of what’s happening at your school and in your community.

But it doesn’t end there. As CSLX Research Associate Karina Ruiz always reminds our team, it’s important to ask questions of your data–and to challenge whether you’re even asking the right questions!
From student attendance rates to test scores, survey results to program participation rates, community school practitioners interact with a wide range of data through the course of any given week, month, or school year. Different forms of data serve specific, often different, purposes. Community school (CS) practitioners and teams that have a curiosity-centered mindset pull data, gather interest holders, and dig deep on questions about what the data is telling them.
When you use a reliable and inclusive process to engage a wide range of interest holders to test your assumptions, the data becomes an invitation for people to engage in shared problem solving. The community school goals, priorities and plans you develop will speak to a deeper understanding of the experiences of students, families, and school staff.
Let’s say you pull your attendance data and you see that your chronic absence rate is six percent. In a data culture of compliance, you might just take that at face value and move on to the next thing on your list.
But when you take a curiosity-focused mindset, you might ask your team additional questions. For example, who is in that six percent? How might you seek to understand who those students are and what’s happening for them that’s making it difficult to go to school?
Think about it as a good, old-fashioned paint-by-numbers kit. You wouldn't paint the sections that have your favorite color, or only buy only some of the paint colors you’ll need – if you did, you wouldn’t have a complete picture. It’s when you fill in all the blanks, gather all the paint colors you’ll need to complete the project, and follow the directions so that the colors work together and complement each other, that you end up with a much lovelier product (it might even unleash next-level creativity for your next work of art).
I’m going to be optimistic and assume that we’ve convinced you to take a curiosity-focused mindset with your data–but what will it take to get there?
The “Beyond the Needs Assessment” virtual workshop is about helping you understand data collection and analysis through a community school (and curiosity!) lens. By joining, you’ll explore how data is used at different stages of community school development, and play around with interactive data collection and meaning making practices with fellow community school leaders. As a bonus, you’ll also get a number of free tools and materials designed to support your equity-driven work.
This event has ended. Questions? Email us at love@cslx.org.

James began his professional experience in education as a college admissions officer and later transitioned to a career in K-12 education as an elementary school teacher and leader. He has extensive experience collaborating with practitioners and conducting equity-focused, policy-oriented educational research, most recently at the University of Southern California. He holds a PhD in Urban Education Policy (University of Southern California '23), an MEd in Educational Administration and Policy (University of Georgia '17), and a B.A. in Political Science and Sociology (Georgia College & State University '13).